Study Methodology
This study is based on anonymised analysis of 247 food trucks in France and the United Kingdom that used FoodTracks between January 2024 and December 2025. Data includes invoice scans, SumUp sales, and stock logs. Results were segmented by size (annual revenue), cuisine type, and geography.
Sample:
- 247 active food trucks (minimum 6 months of data)
- 68% France, 32% United Kingdom
- Average revenue: £76,800/year (€87,400)
- Analysis period: 24 months
1. The Number That Hurts: €200/Month Going in the Bin
Our analysis reveals that 82% of food trucks in our panel record food waste losses exceeding €200 per month — that's €2,400 per year.
To put that in perspective:
| Waste category | Average monthly loss | |---|---| | Expired products not used | €94 | | Overstocking (unsellable surplus) | €71 | | Portioning errors | €38 | | Over-production during cooking | €28 | | Breakage and accidents | €12 | | Total average | €243/month |
On an average monthly revenue of €7,280, these losses represent 3.3% of gross revenue — a ratio that can reach 6.1% at trucks with the weakest management tools.
---
2. The 5 Root Causes of Food Truck Waste
2.1 "Gut-Feel" Ordering: Root Cause #1 (41% of cases)
41% of waste comes from poorly calibrated orders. Without structured historical data, most food truckers order based on memory or rough estimates.
Result: 1 in 3 trucks orders more than 15% excess stock for a given service.
> "I used to order 8kg of meat for Wednesday market because that's what I'd always done. FoodTracks showed me I was actually using an average of 5.4kg. I recovered €70/week immediately." > — Thomas R., burger food truck, Lyon
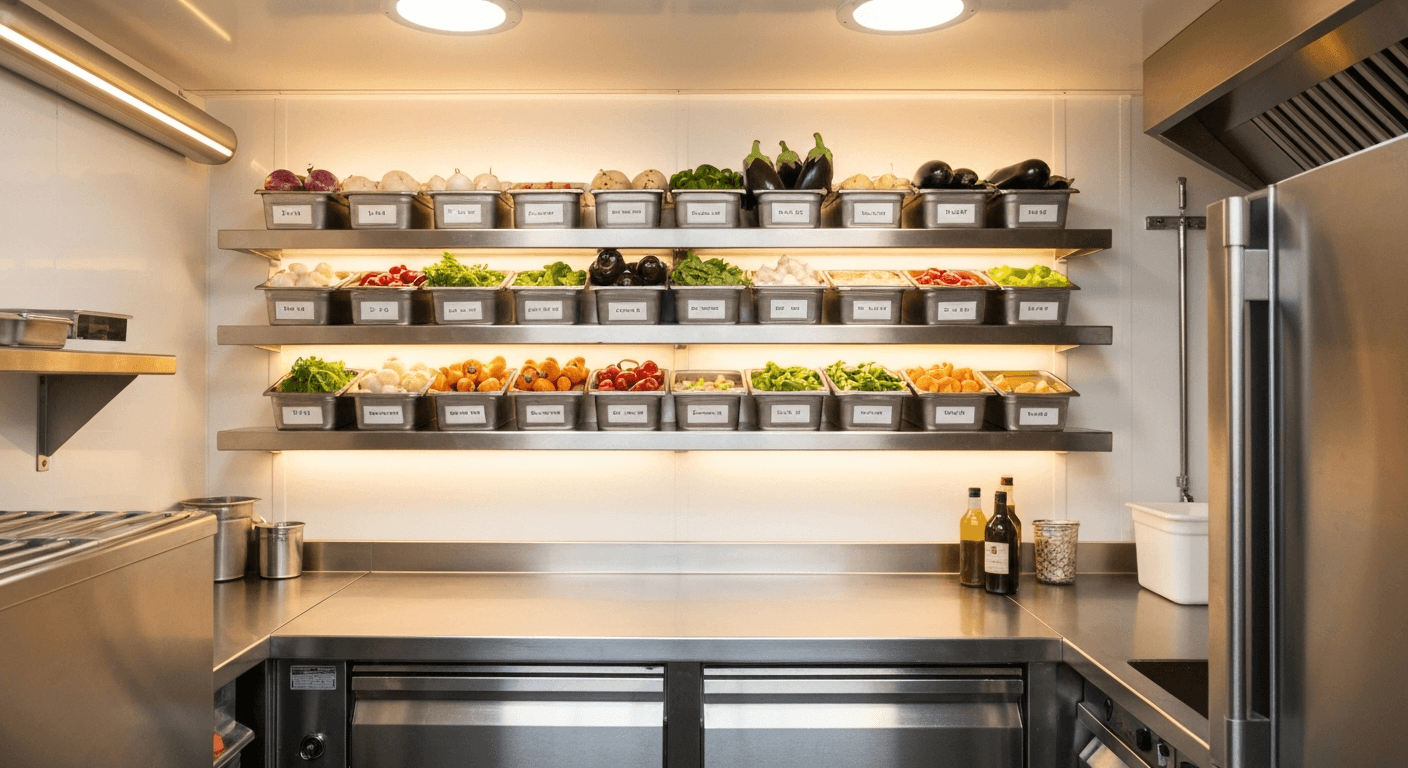
2.2 No Expiry Tracking: 23% of Losses
23% of losses are directly linked to products used past their optimal date or discarded at expiry. In our panel, 63% of food truckers report having no formal DLC/expiry tracking system.
Most affected categories:
| Category | Average loss rate | |---|---| | Dairy (cheeses, creams) | 8.2% | | Fresh meat | 6.4% | | Fresh vegetables | 11.7% | | Herbs and aromatics | 19.3% | | House-made sauces | 14.1% |
Herbs and aromatics show the highest rate at 19.3% average loss — often purchased in large quantities while actual needs are small.
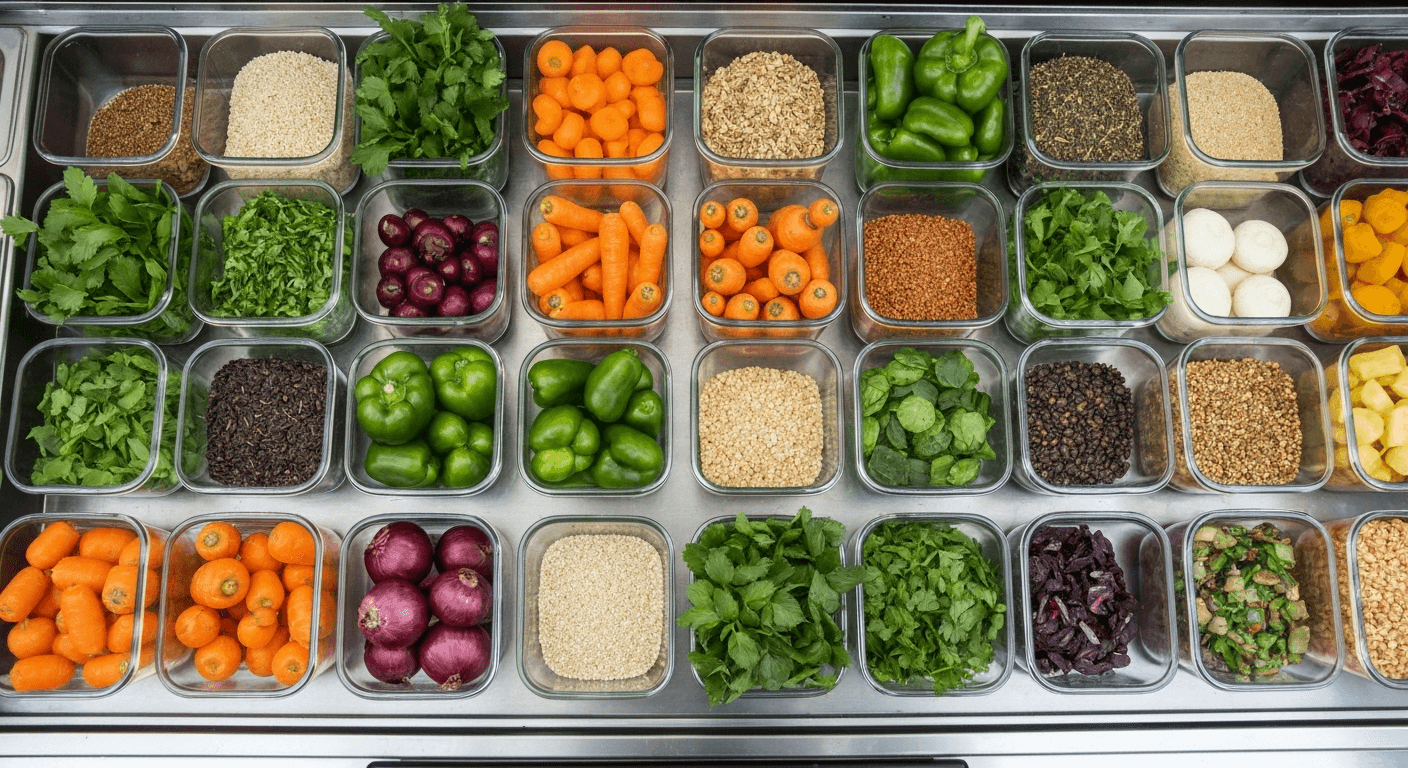
2.3 Non-Standardised Portioning: 16% of Losses
Without recipe cards with precise weights, every dish is a source of variation. Our analysis shows an average standard deviation of ±23% on portion weight at trucks without recipe cards, versus ±7% at those with recipe cards.
On a €12 burger with a 180g meat target:
- Average actual portion observed: 197g (+9.4%)
- Extra cost per burger: ~€0.21
- Over 80 burgers/day × 200 days: €3,360 in lost raw material per year
2.4 Ignoring the Weather: 12% of Losses
77% of food truckers do not consult weather forecasts when calibrating orders. Yet our correlation model shows:
| Weather condition | Impact on sales (vs. standard conditions) | |---|---| | Sunny >22°C | +34% | | Light rain | -18% | | Heavy rain | -52% | | Wind >40 km/h | -29% | | Overcast without rain | -8% |
An unanticipated rainy Sunday can turn a stock ordered for 120 covers into 50 unsold covers — €40–70 in direct losses depending on cuisine type.
2.5 End-of-Service Over-Production: 8% of Losses
8% of waste occurs in the last 30 minutes of service. Not knowing how many customers remain, food truckers continue producing "just in case." This end-of-service over-production averages €18 per service.
---
3. The Profile of the Lowest-Waste Trucks
Analysis of the top 15% most efficient trucks (waste < €80/month) reveals common practices:
| Practice | % of efficient trucks | % of average trucks | |---|---|---| | Recipe cards with portion weights | 94% | 31% | | Formalised expiry tracking | 89% | 37% | | Orders based on historical data | 78% | 22% | | Weather-adjusted orders | 71% | 23% | | Dedicated management software | 87% | 29% |
The correlation is clear: digital tooling is the most discriminating factor. Trucks using dedicated management software waste an average of 67% less than those relying solely on paper notebooks or spreadsheets.
---
4. Profitability Impact: What the Numbers Say
4.1 Perceived Margin vs. Real Margin
In our panel, the gap between perceived margin (mentally calculated) and real margin (measured by FoodTracks) is significant:
| Annual revenue band | Average perceived margin | Average real margin | Gap | |---|---|---|---| | < €50,000 | 28% | 19% | -9 points | | €50,000–100,000 | 31% | 24% | -7 points | | €100,000–200,000 | 33% | 28% | -5 points | | > €200,000 | 35% | 32% | -3 points |
Trucks with the lowest revenue underestimate their real costs by 9 margin points. For a truck doing €50,000/year, this represents €4,500 in hidden annual losses.
4.2 ROI of Waste Reduction
If a truck brings its waste from €243/month (average) to €80/month (top-15% level), the net gain is €163/month, or €1,956/year.
Adding portioning optimisation (+€3,360/year estimated above) and reduced over-ordering (+€840/year estimated), the total recovery potential exceeds €6,000/year for an average-size truck.
---
5. Solutions That Actually Work
5.1 Automatic Invoice Scanning
Manual purchase entry is the primary reason food truckers lack reliable data. 74% of FoodTracks users started scanning invoices without having done any stock tracking before.
Invoice scanning (see the feature) reduces entry time from 47 minutes/week on average to under 5 minutes.
5.2 AI Predictions by Location and Weather
FoodTracks' AI sales prediction module cross-references:
- Your historical sales at each GPS zone
- Weather forecast (source: Météo-France and Met Office UK APIs)
- Event type and day of week
5.3 Expiry Alerts
Automatic alerts 48 hours before expiry allow menu adaptation or stock clearance. Trucks with this feature enabled reduced expiry losses by 58% on average over 3 months.
5.4 Integrated Recipe Cards
Creating recipe cards directly in FoodTracks (linked to invoices for real-cost calculation) enables portioning monitoring. Trucks with at least 5 active recipe cards show an average portioning variance of ±8% vs. ±24% for those without.
---
6. France vs. United Kingdom Comparison
| Metric | France | United Kingdom | |---|---|---| | Average monthly waste | €238 | €261 | | % trucks losing > €200/month | 80% | 86% | | Primary waste driver | Expired products | Overstocking | | Dedicated software adoption | 24% | 31% | | Average gross margin | 25% | 23% |
UK trucks waste slightly more (+9%) primarily due to more pronounced overstocking practices, linked to greater and less-anticipated weather variability.
---
Conclusion: €2,400 That Shouldn't Go in the Bin
Food waste in food trucks is a structural problem, not an inevitability. Our data clearly shows that trucks that get properly equipped recover an average of 60% of their losses within the first 90 days.
The three first actions with immediate impact:
- Scan all invoices starting today to build a reliable data foundation
- Create recipe cards for your 5 main dishes
- Enable weather predictions before each order
Read also: How to Manage Food Truck Inventory Efficiently · AI Sales Predictions for Food Trucks · FoodTracks Features Overview
Frequently Asked Questions
- How much does the average food truck lose to food waste?
- According to our study of 247 food trucks in France and the UK, the average loss from food waste is €243/month, or €2,916/year. 82% of trucks exceed the €200/month threshold.
- What is the main cause of food waste in food trucks?
- The main cause is poorly calibrated ordering (41% of losses), made without reliable historical data. Next comes lack of expiry date tracking (23%) and non-standardised portioning (16%).
- How can a food truck reduce its food waste?
- The three highest-impact actions are: scan all invoices to build reliable data, create recipe cards with precise portion weights, and use AI predictions based on weather and sales history to calibrate orders.
- Do UK food trucks waste as much as French food trucks?
- UK food trucks waste slightly more (€261/month vs. €238/month), primarily due to more pronounced overstocking driven by greater and less-anticipated weather variability.
- What is the average gross margin for food trucks?
- In our panel, the average real gross margin is 25% in France and 23% in the UK. Note: perceived margin is often overestimated by 5 to 9 points, as waste costs are not properly accounted for.